Technical Methodology
a unique systematic approach to developing custom indicators and indices

Throughout Guy’s tenure in the investment management industry, he’s been positioned to help shape financial strategies at two of the world’s most esteemed firms: Fidelity Investments and Wellington Management Company. His technical skills have enabled him to sort through vast datasets with cutting-edge technologies, enabling him to separate viable emerging market themes across equity market sectors and industry groups as well as diverse asset classes. The application of these specialized skills was a natural fit for hedge fund portfolio management.
The Art of Analytical Depth
Guy’s ongoing success is attributed to his disciplined, systematic approach. Using his unique suite of custom indicators and indices enables him to evaluate current market dynamics to be analyzed for nuances in short, intermediate, and long-term investment horizons. Ultimately, that methodology helps in discriminating his two objectives for stock recommendations: relative outperformance and reduced risk. Portfolio diversity and beta balance within the correct context of the overall market trend historically has resulted in his above-competitive returns. Using technology to cull a large universe of data to be distilled into actionable ideas is what Guy has done throughout his career.

Introducing Money Flow Units (MFU)
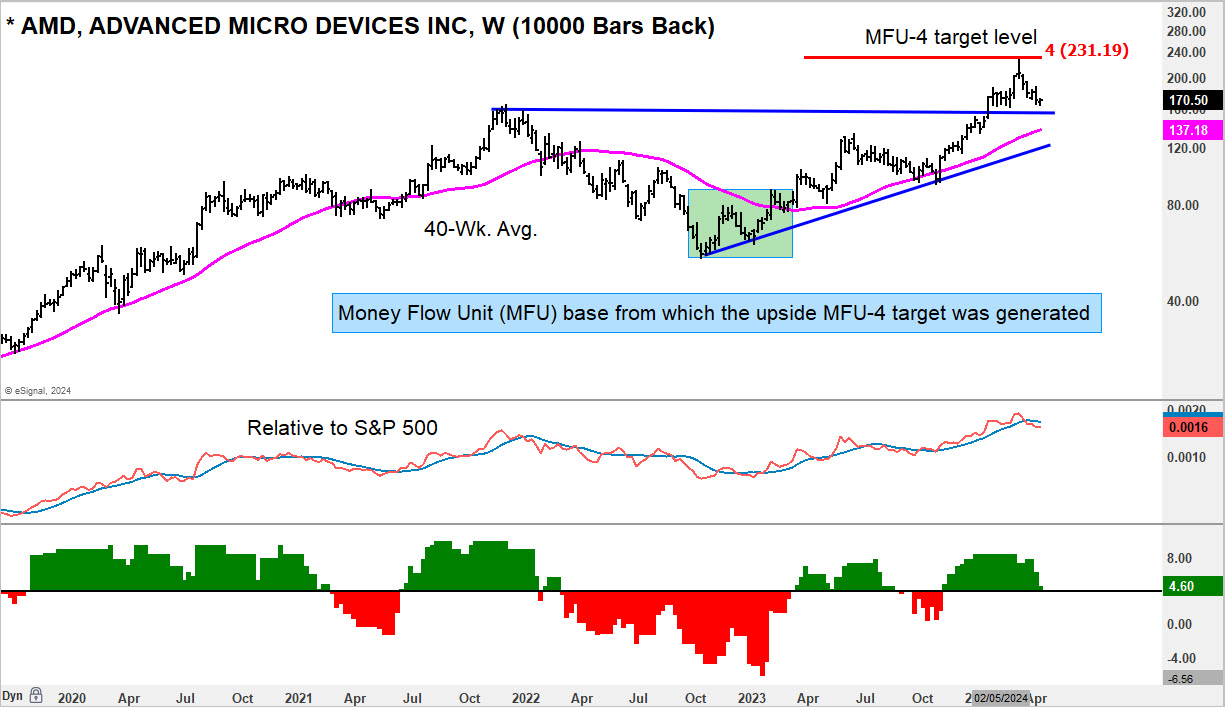
At the core of Guy’s approach are “Money Flow Units” (MFU), something known to only three other people in the industry. Over the span of the last almost forty years, this proprietary model has been enhanced with additional qualifying inputs, which has strengthened the money flow units analysis. The MFU measures the capital flow in and out of an asset. Think of these as baskets of capital that flow into a stock, an index, or other price-based assets when bottoming out. At some point, the amount of capital flow will overwhelm supply and propel the next leg up, forming the MFU targets. Conversely, at highs, an MFU will form and overwhelm demand which will start the downside process.
- MFU-2: Marks the initial zone for counter-trend movements: prime opportunity for strategic entries post-bottom formation.
- MFU-3 or MFU-4: Signals significant counter-trend movements or the culmination of a previous price direction: contingent on the prevailing market cycle.
- MFU-5: A rare occurrence, exhaustion identification in extreme market cycles marked by robust momentum — prime target example: S&P 500 shifts in March 2000 and March 2009.
The Synergy of Technology and Insight
The CIR amplification of MFU analysis reaches toward intermediate to long-term assessments. For equites, top-down breakouts perspectives are sequentially ordered examining relative strength of the sector, each industry, and each stock within that industry. This analysis is further integrated into CIR’s proprietary multi-factor stock ranking model to improve the historical odds for successful long or short position targeting. Beyond equities, the MFU analysis also finds application in other financial instruments including currencies, commodities, and fixed income. Clients receive this output in our weekly reports and spontaneous technical bulletins issued throughout the week.

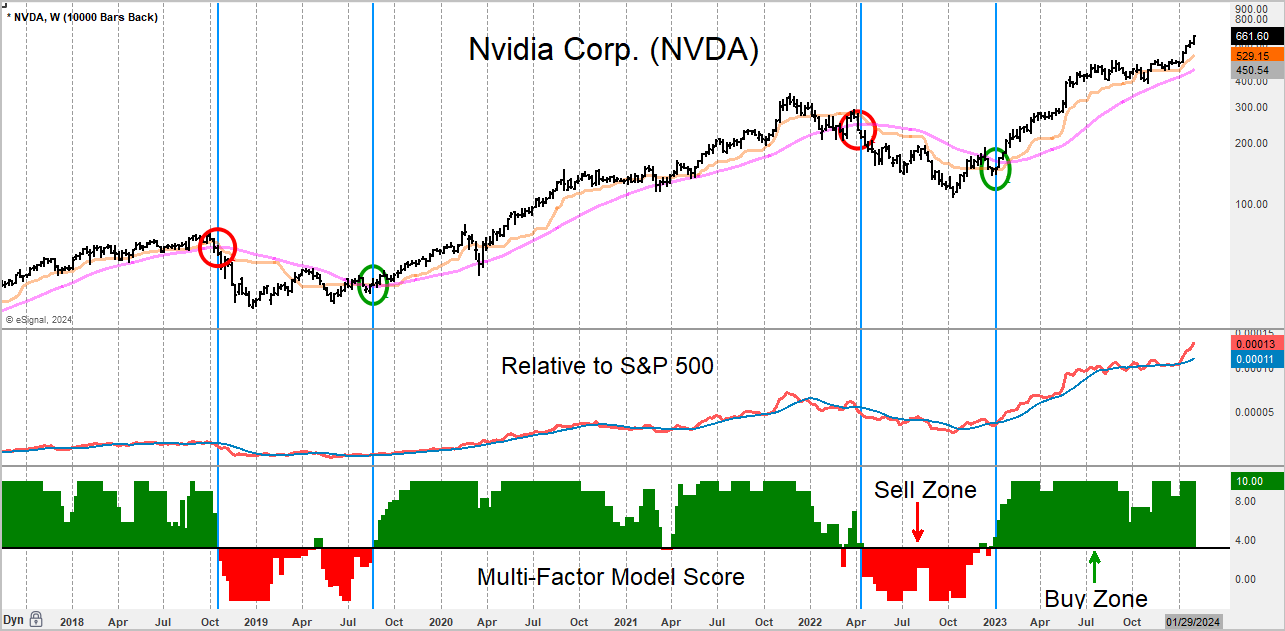
Illustrated Success: Nvidia
While there are countless examples repeated over the many years that this story exemplifies, the rise and fortunes made from owning Nvidia’s stock is apparent to most investors, hence a good chart to show how our work projected a major winner. Those earlier spotlights made even more pronounced by the recent AI craze has made it “the stocks to own.” In the chart shown here, we see the trajectory of the prior six-year period. Note the markup points for buy and sell signals generated by the model going bullish or bearish. These points were derived in a systematic process using the multi-factor model score.
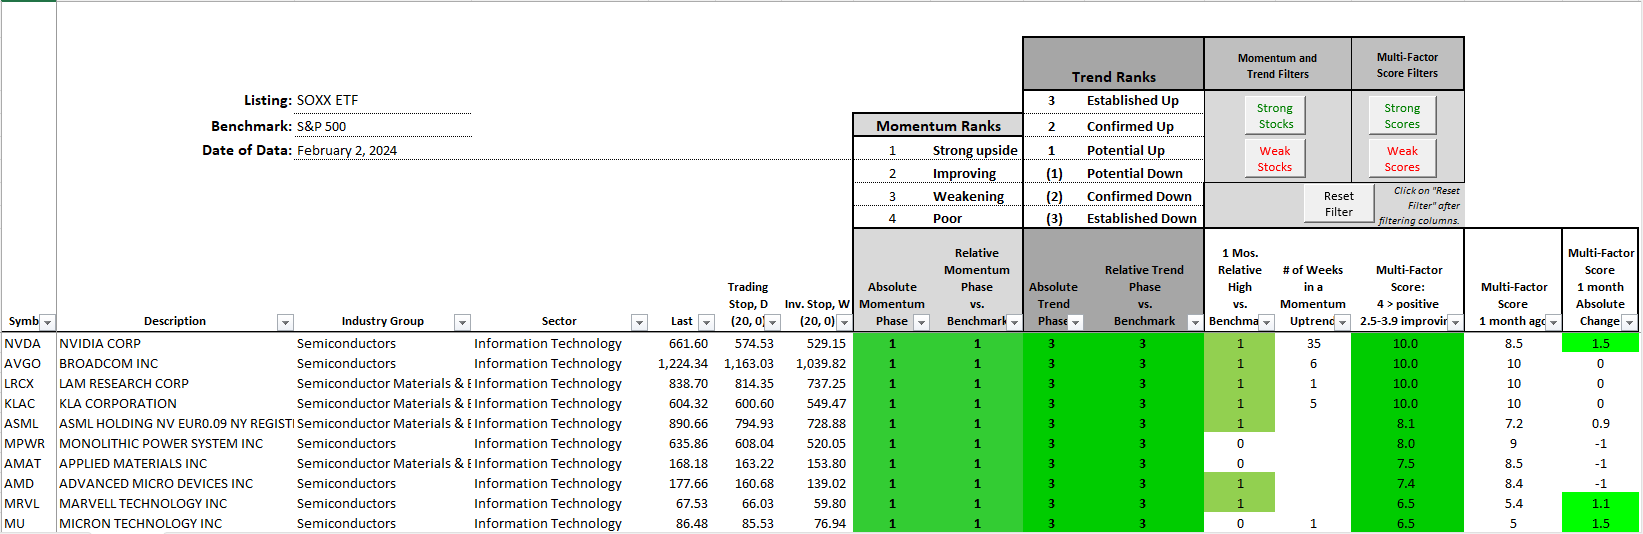
Illustrated Success: An example of the Industry group associated with Nvidia
CIR’s published analysis of the iShares Semiconductor ETF (SOXX) on February 2, 2017, was an extension of the positive setup seen for Nvidia and other semi-conductor stocks. Nvidia is a constituent of the iShares index further reinforcing the spotlight recommendation for both and other semiconductor stocks. The ranking screen used for the ETF was the same as that used for Nvidia across all global equities in the CIR universe. This example magnifies the importance of screening beyond just the equity.